


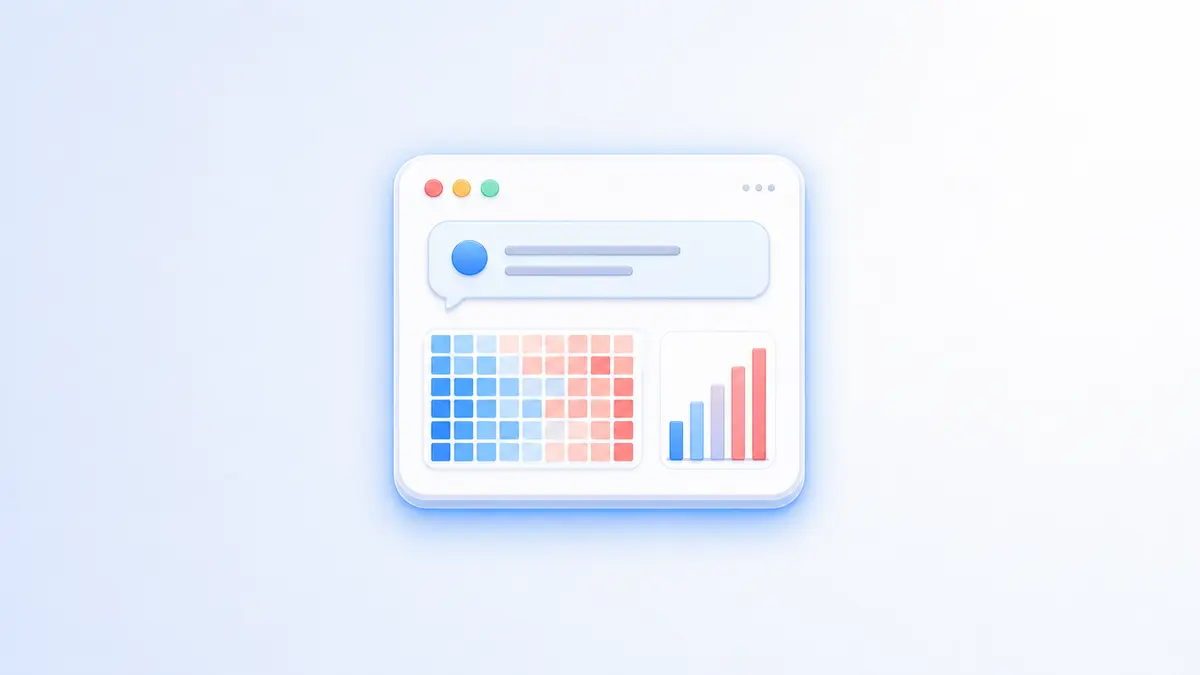
A playtest ends, and your community channel fills with latency complaints. You want logins by hour and region for last night, and the dashboard only shows daily actives.
Most online service platforms come with basic analytics dashboards covering metrics like daily and monthly active users, new registrations, and revenue. These dashboards are useful for monitoring general player activity, but they are typically limited to predefined metrics and reports.
AGS generates events from player activities across the platform, including account creation, login, joining a party, matchmaking, purchases, and game progress. These events provide valuable data for understanding player behavior and how players interact with your game.
For more advanced use cases, you can stream these events into your own data warehouse using the AGS Data Connector and build a complete analytics solution. This is a good option for studios with dedicated data teams and long-term reporting needs.
For more general analytics needs, AGS AI Analytics offers a simpler approach. It's particularly useful if you don't yet have a dedicated analytics solution, or if you want to explore your data and identify useful metrics before investing in a more advanced setup.
With AI Analytics, you can query your AGS events by asking Claude, connected to AGS through MCP, with the following benefits:
-
No additional integration work.
Your AGS events are already available to query. Connect your AI agent and start asking questions. -
No additional infrastructure.
There's no need to provision a data warehouse, maintain an ETL pipeline, or license a BI tool. -
Built for exploration and discovery.
Useful for studios that don't need a dedicated analytics solution, or want to explore their data before investing in one. -
Read-only and scoped to your game.
Your agent runs read-only queries against your own namespace, so it can't change your game data or see anyone else's.
More than Basic Analytics
Basic analytics dashboards cover common metrics such as daily active users, monthly active users, and total registrations. For more specific analysis, you may need to break down metrics by additional dimensions or compare different groups of players. Depending on your analytics platform, this may involve exporting data, writing SQL queries, or requesting custom reports from your data team.
With AI Analytics, you can describe what you want to analyze in natural language and let your AI agent handle the query.
Metric Breakdown
For example, your team notices a community post about latency issues from your playtest or event, and wants to analyze login activity by region and time to understand which user populations were most affected.
"Show me the number of players who logged in each hour yesterday, broken down by region."
Your agent identifies the relevant login events, filters them by date, groups the results by hour and region, and presents them in a table.
You can also refine the results with follow-up questions, such as "Only show the 6 PM to midnight window" or "Compare that with the same day last week."

Cohort Analysis
Another example is analyzing player participation following a weekend event. You may want to understand whether the event attracted new players or encouraged existing players to return.
"Compare newly registered players with returning players who logged in last weekend."
Your agent identifies players who registered during the weekend and those who already had an account, then summarizes the results for each group.
You can follow up with "How many of the new players came back on Monday?" to explore early retention without creating a dedicated cohort report.

Fast Discovery and Prototyping
AGS provides flexibility in how you build your game's backend. You can combine services such as Statistics, Cloud Save, Virtual Currency, Entitlements, and Matchmaking based on your game's requirements.
This also means that the data you want to analyze may be specific to how your game uses these services. For example, your battle pass progression might be stored in Cloud Save, while players use virtual currency to unlock additional maps.
AI Analytics allows you to provide your agent with context about your game's data. You can describe what a Cloud Save record contains, how your progression system works, or what a custom event represents. Your agent can then use this information when answering questions.
Example: Player Progression Across Features
Suppose your game tracks player experience points using AGS Statistics, while level thresholds and battle pass tiers are defined in a Cloud Save game record.
"Using the battle pass tiers in Cloud Save, show how many players are at each tier based on their current XP."
Your agent uses the tier definitions and player XP data to determine how players are distributed across the different tiers. This can help you understand progression patterns and identify tiers where players may be spending more time.

Example: Content Unlocked with Virtual Currency
Another example is a game where players spend virtual currency to unlock new maps or levels.
"Which maps were unlocked most with currency this month, and how long after registering did players make that first purchase?"
Your agent uses the relevant wallet transactions and content data to identify which maps are being unlocked and when players make their first purchase.

These types of insights typically require custom queries, data transformations, or dedicated dashboards. With AI Analytics, you can explore different questions, evaluate whether the results are useful, and decide which metrics are worth including in your long-term reporting.
Try It in Early Access
AI Analytics provides a lightweight way to explore your existing AGS data without setting up a dedicated analytics infrastructure. You can use it to answer questions beyond your standard dashboards, experiment with game-specific metrics, and identify insights that are useful for your team.
AI Analytics is currently in early access on both Public Cloud and Private Cloud. If you're interested in trying it with your game, reach out to your AccelByte representative or contact us to join the program.
To see how it works, read Getting started with AGS AI Analytics.
Ask Your Game Data Questions in Plain Language
AI Analytics lets your AI agent query the events AGS already records, with no data warehouse, ETL pipeline or BI tool to set up. It's in early access now; talk to us to try it with your game. New to AGS? Get started with AccelByte Public Cloud, free during development for up to 30 concurrent users (CCU).
You're almost signed up!
Verify your account by following the instructions sent to .
If you still haven't received an email, please check your spam folder.
Featured Blog Posts




Bring your first player online today.
Get started for free, and scale as your game grows.