- Share
-

-

-

-


Author: William Wu, PM-AGS Core OS
Earlier this year our team was tasked with ensuring the scalability of our infrastructure while reducing costs and maintaining the same service quality. This is the first part in a series of articles that covers how we achieved this goal.
In this first edition, we will discuss how we tested and improved the key scenarios across the core services to hit our initial Concurrent User (CCU) target of 500K.
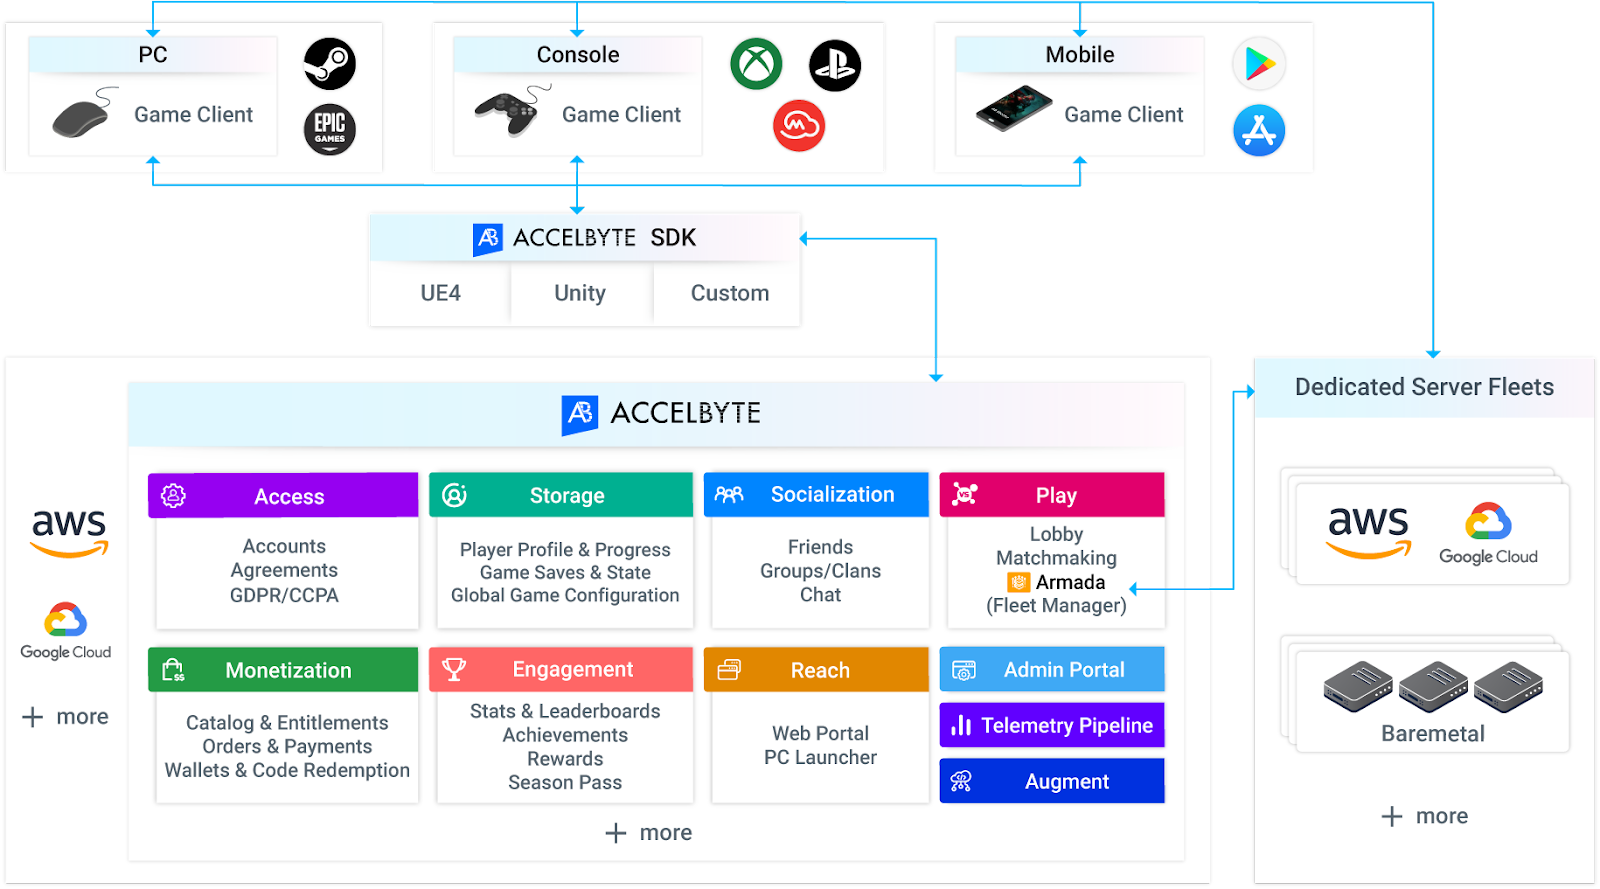
AccelByte Cloud is a suite of online services for games to scale to millions of players so the game developers can focus on the game, not the backend.
AccelByte Cloud does that through:
- Comprehensive set of online services for game and publishing needs
- Single-tenant infrastructure and managed services
- Complete data ownership
- Extensible and scalable microservices architecture
- 4/7 Operation team; default 99.6 Production SLA
AccelByte Cloud Infrastructure
AccelByte Cloud is a collection of microservices, each organized by a business domain the service is responsible for. AccelByte Cloud adopted the microservice pattern from the start as it allows each service to be highly maintainable, testable, loose coupled, and independently deployable by a small team.
Load Testing Preparation
Set Up Environment
The first step is to set up a testing environment and tools. We deployed all our services in AWS EKS with a dedicated EKS cluster based on our production environment setup template.
The Attacker is a tool that we use to generate requests in our load test. Our Attacker was using Amazon EC2 Linux instances with Ubuntu OS. It allows us to scale up and scale down the size easily. We started the testing with the Attackers in the same AWS zone to tune the environment and tooling and moved the Attackers to a different region/zone as we scaled the testing to simulate more live-environment-like results.
Seeding Script
To simulate a production environment, we create a set of seeding scripts to populate the environments with seeding data such as accounts, entitlements, friends, player records across the services. Depending on the scenario and service, we seeded some of the data directly to the database, and some via API calls.
Attacker Scenario Script
We monitored some of our client's live environments, looked at the traffic pattern, and developed our attacker scripts to mimic those scenarios and traffic patterns. We used K6 as the tool to develop the scenario as it's scriptable in plain Javascript, has a great scripting API, and supports both RESTFul and Websocket calls.
Running the Load Tests
There are four things we need to figure out:
- How many transactions per minute (TPM) can a single pod of each microservice supports?
- How many queries/TPM can different instance types of the database support?
- What is the scaling behavior of a single service under load and how much resources are needed to support a specific number of CCU or TMP targets?
- When the services work together, do they scale in the same way?
Test targets:
- Success rate > 99.99%
- P99 < 2 seconds
- PCCU >= 500K with integrated scenarios across services
Test methods:
- Individual test for each service: run K6 for every single endpoint to check out the performance of the specific scenario, try to find the capacity per pod, scale pod count to find the database limitation, identify bottlenecks, implement improvements, and repeat the testing until the next bottleneck.
- Integration test for all services: simulate the real user experience by running multiple endpoints with a logical sequence and controlling the number of requests to each service. We also add the network latency to make it more like the real environment.
Besides that, we adjusted different resource size, type, and count parameters based on the test results and monitored data to achieve the best cost-value purpose.
Load Testing Monitoring
Monitoring is the key to getting visibility on the result and bottleneck of the system. We used a number of game performance testing tools to monitor the system for different purposes.
- K6 reports showed the performance result from the Attacker perspective, we used it to capture data such as transaction counts, success rate, P99.
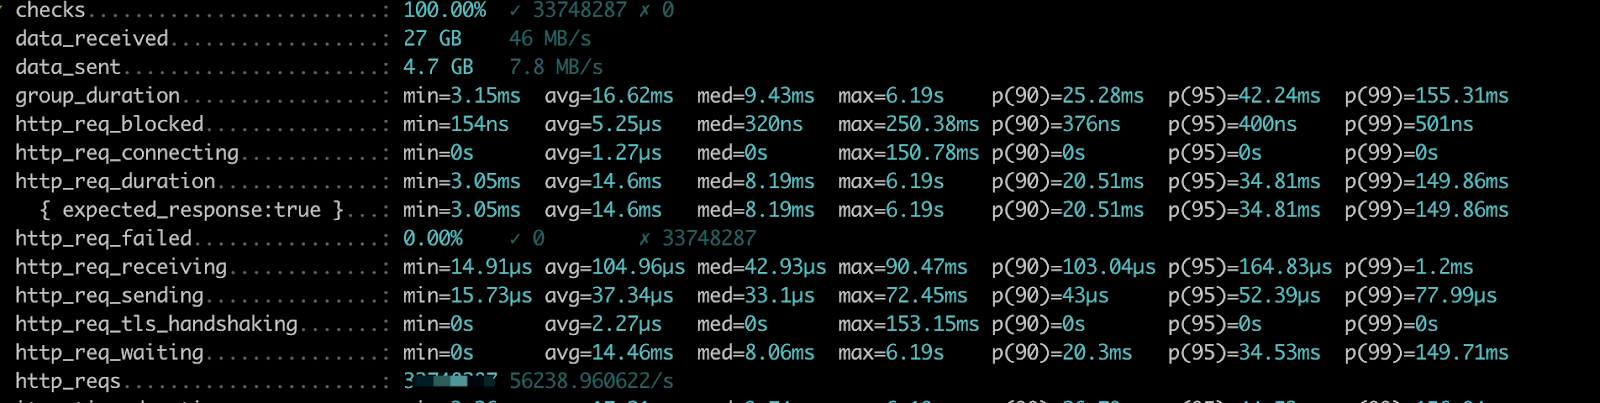
For most API, the response time can be done in 100ms, some complex API needs a longer time than that, but all queries can be done in two seconds.
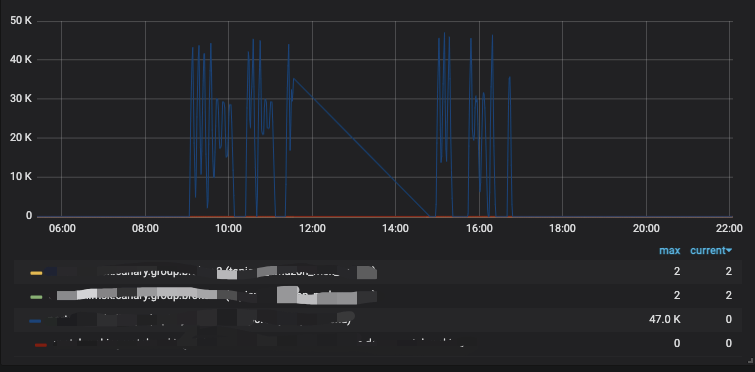
- AWS Cloud Watch showed the transaction from the service perspective.
- We also monitored custom metrics data in Prometheus, it showed the pod count, transaction, CPU, and memory usage of the services being attacked.
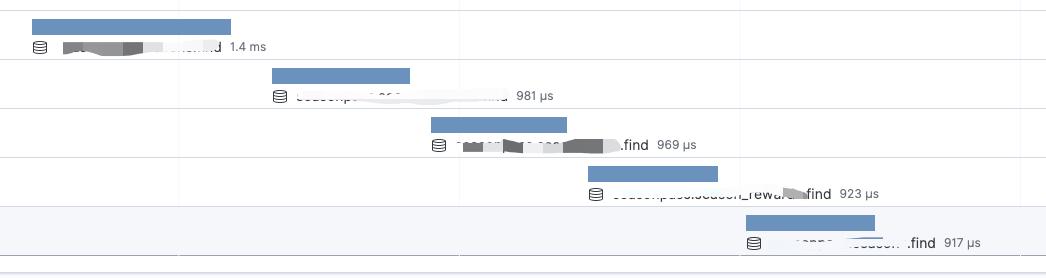
- Application Performance Monitoring (APM). When a certain scenario/service is running into a bottleneck and scaling issue, we instrumented the service with APM to dissect the service call, and examine the execution status and chain to locate the underlying problem.
Load Testing Optimization
- Refactor business logic: we optimized business logic for both standalone calls and calls that would invoke a number of microservice chains. The optimization included feature flow, data schema, algorithm, and patterns such as using async action in certain situations. We also simplified some unnecessary implementations to minimize the mutual calls between services and minimized the payload of interaction.
- Scaling database: we separate the read and write operations on our databases. At the service layer, the read/write separation was implemented in the database libraries. Before the database operation, the db-resolver is used to determine whether to use the read database or write database. SQL is investigated in db-resolver to decide whether the query is a query or update within or without a transaction. We also optimized database indexes and fixed the incompatibility between DocumentDB and MongoDB.
- Cache: we use redis as a centralized cache and also high speed memory cache in standalone service. We cached the complex computation result to avoid repeating calculation, database query, and service communication.
- Message queue: we leverage more message queue for its peak-shaving effect. Through asynchronous processing, the transaction messages generated by the burst of high concurrency are stored in the message queue, thereby smoothing the concurrent transactions during the peak period.
- Rate limiting: we use ISTIO as a rate-limiting to protect our service from DoS attacks and unexpected huge traffic. We also adjust the configuration for retry and circuit break logic to protect the service.
Key Results
As we concluded the first phase of our load test effort, the system was able to comfortably handle 5 million transactions per minute, with 99% of our requests being less than 400 milliseconds, and a success rate greater than 99.95%. We also successfully reduced the cost of infrastructure by a large factor for each level of CCU target, and standardized our infrastructure setup for different load targets at 5K, 50K, 100K, 200K and 500K CCU.
We are currently working on integrating load testing as part of our development workflow, expanding the test scenarios, achieving higher targets of 1 million, 2-million, and 5-million CCU, and further reducing the infrastructure cost.
In the next article, we will go in-depth to discuss how we tested and scaled our lobby, matchmaking, and dedicated server manager services, and go over how to spin up 5-10K dedicated servers a minute.
To learn more about AccelByte's solutions request a demo here.
Featured Blog Posts


Find a Backend Solution for Your Game!
Reach out to the AccelByte team to learn more.